To add complexity, the data from Temperatur.nu contains numerous NaN values.
I will use Ellevio’s data to fill these gaps.
Although Ellevio’s temperatures are estimates from SMHI, they are sufficient for my use case.
I upload the Ellevio data in Excel format and the Temperatur.nu data
in JSON format to ChatGPT, and then instruct it to merge the datasets.
ChatGPT instructions
Merge the files on the fields time and datetime
From the Json-file:
drill into /stations/0/data/*/ and you find an array of the objects we are interested in.
Save datetime to column name “Timestamp”
Save kW to column name “kW”
Save temperatur to column name “Temperatur.nu”
From the Excel-file:
Save temperature to column name “Ellevio (SMHI)”
Create a new column called “Temperature”. Take all numbers from temperatur (Temperatur.nu) but when a value is missing or NaN then fill in the temperature (Ellevio) instead.
Prepare this as an Excel-file called “trollebo-electricity-temperature-hourly.xlsx”
Now comes the fun part. Its so easy to analyze data that its ridiculous.
Climate data for Noppikoski
ChatGPT instructions
Make a chart of Ellevio (green line) and Temperatur.nu (blue) for the month 2023-01
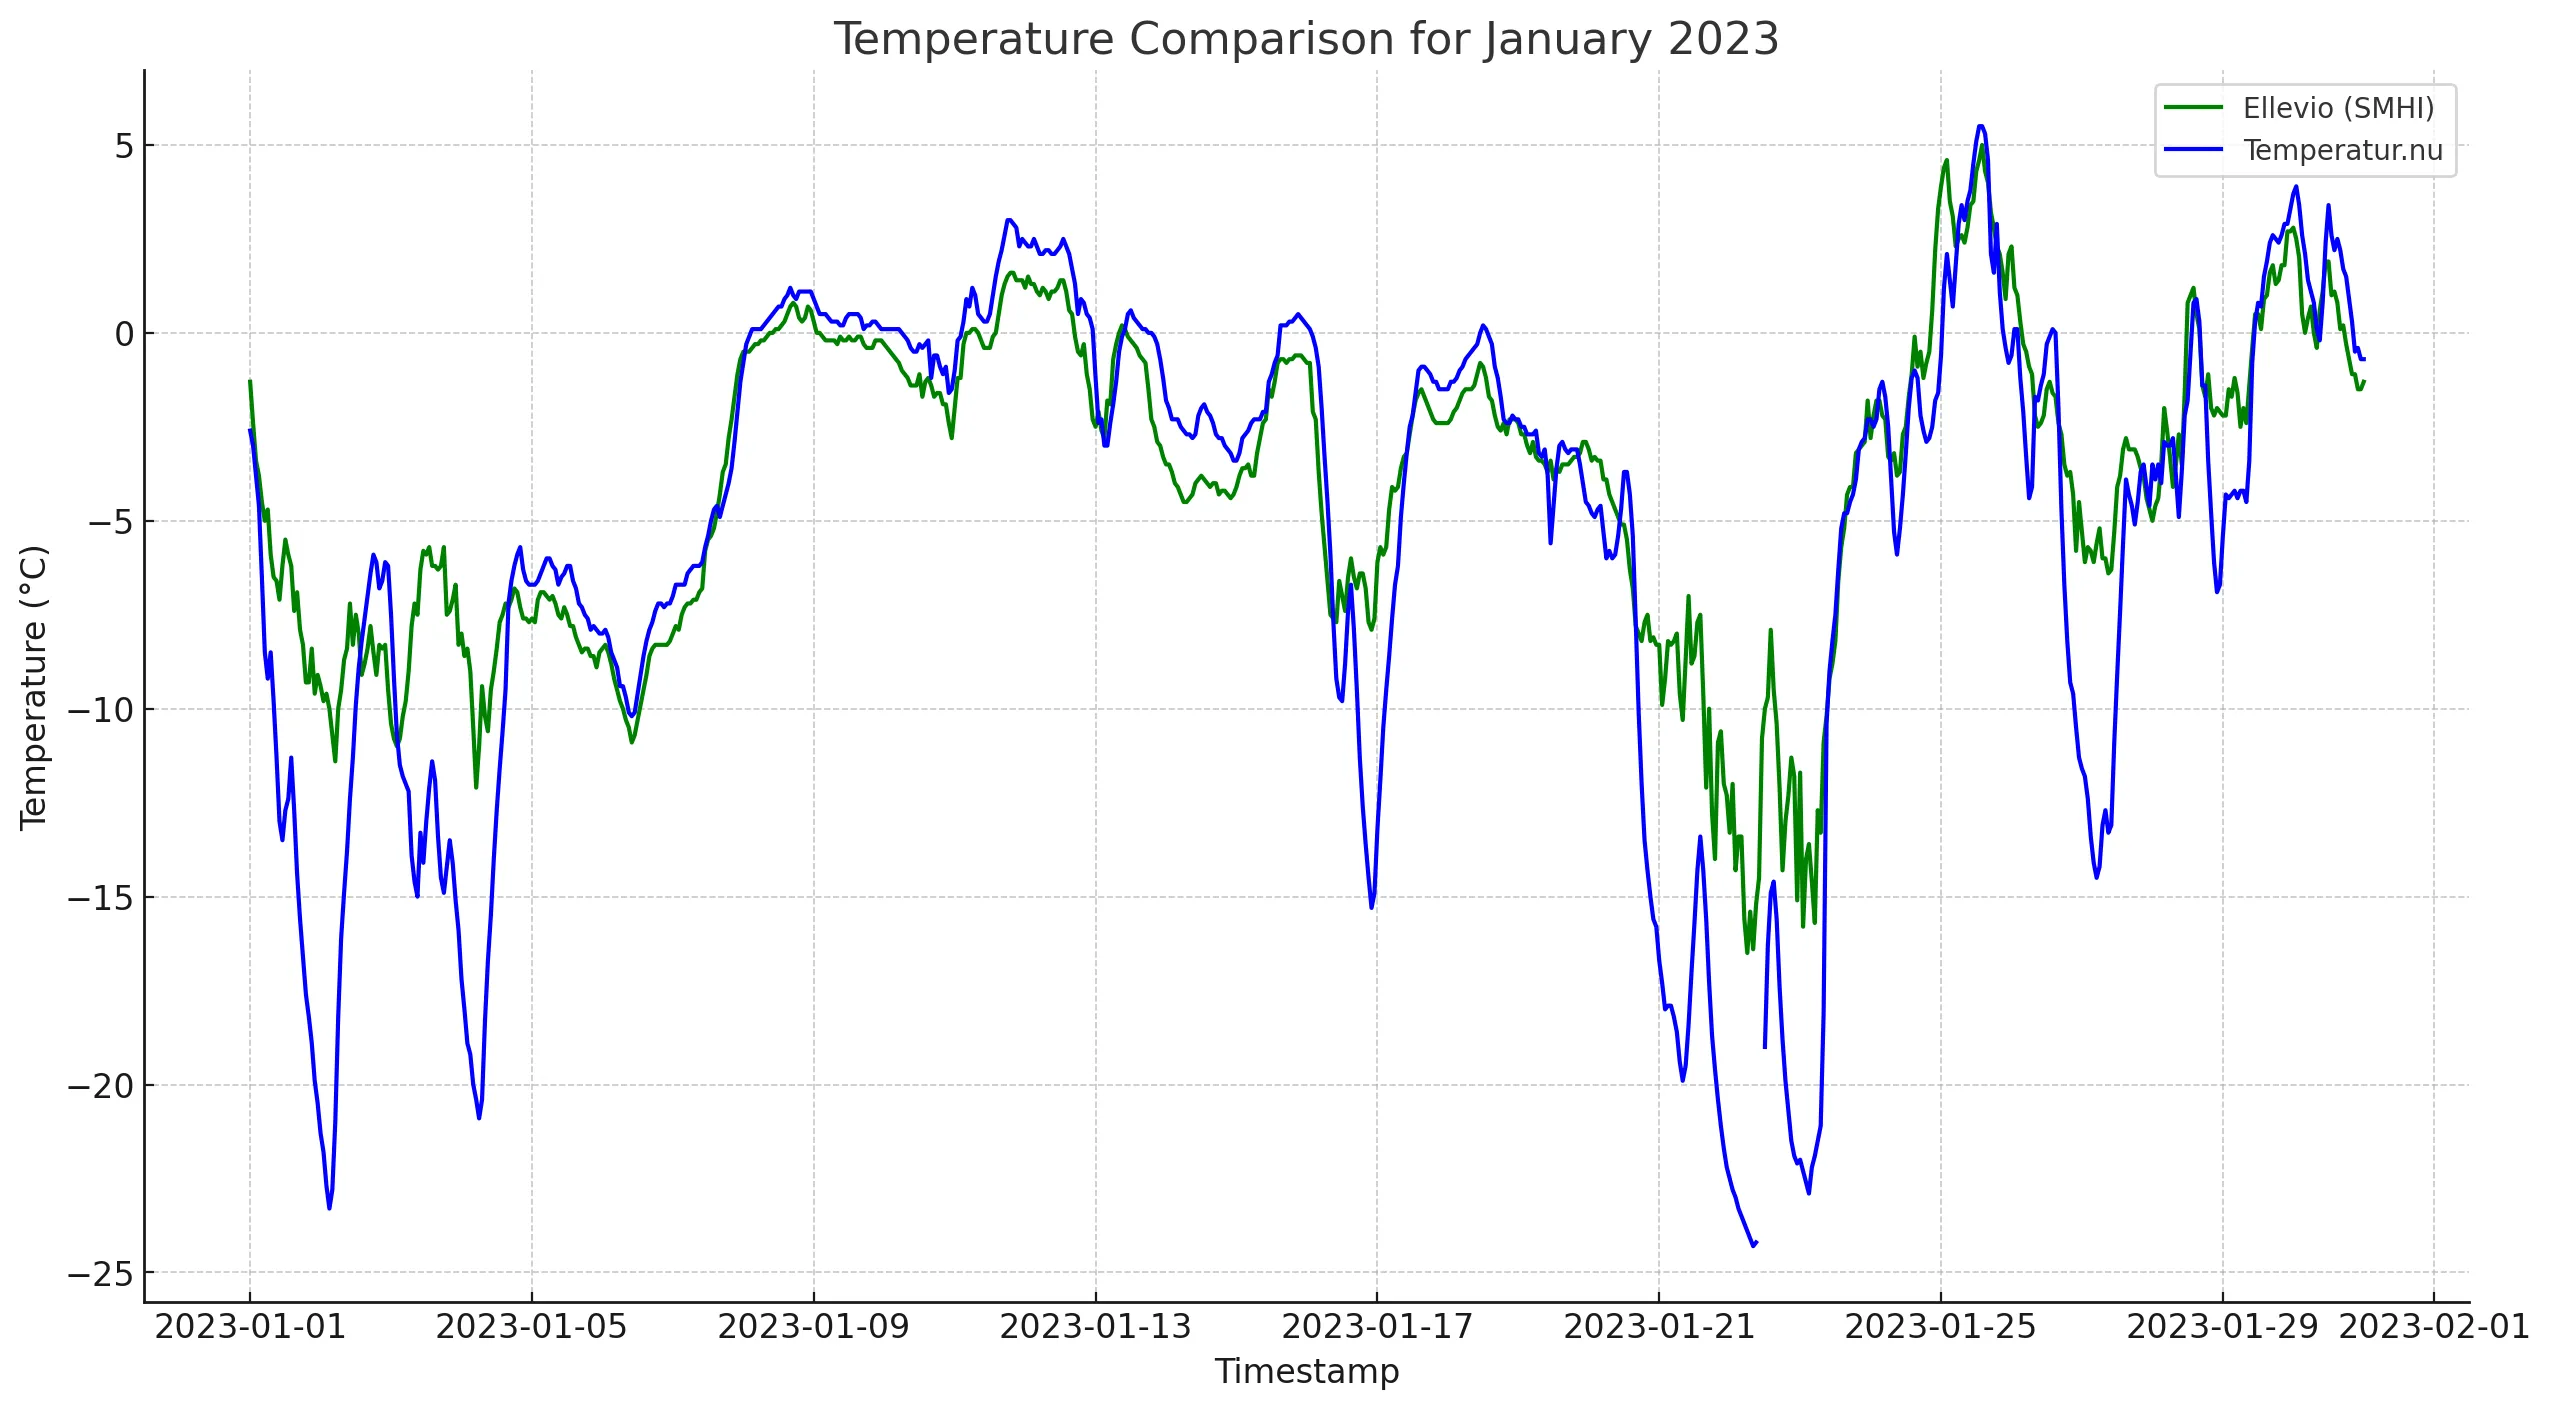
Interestingly, SMHI excels at predicting daytime temperatures but struggles
with cold winter nights. I suspect this is due to our location in a narrow valley,
where temperatures plummet rapidly on calm nights. Additionally,
there’s a gap in the Temperatur.nu data around January 22, 2023,
which is why we’ll fill those values using Ellevio’s SMHI-estimated data.
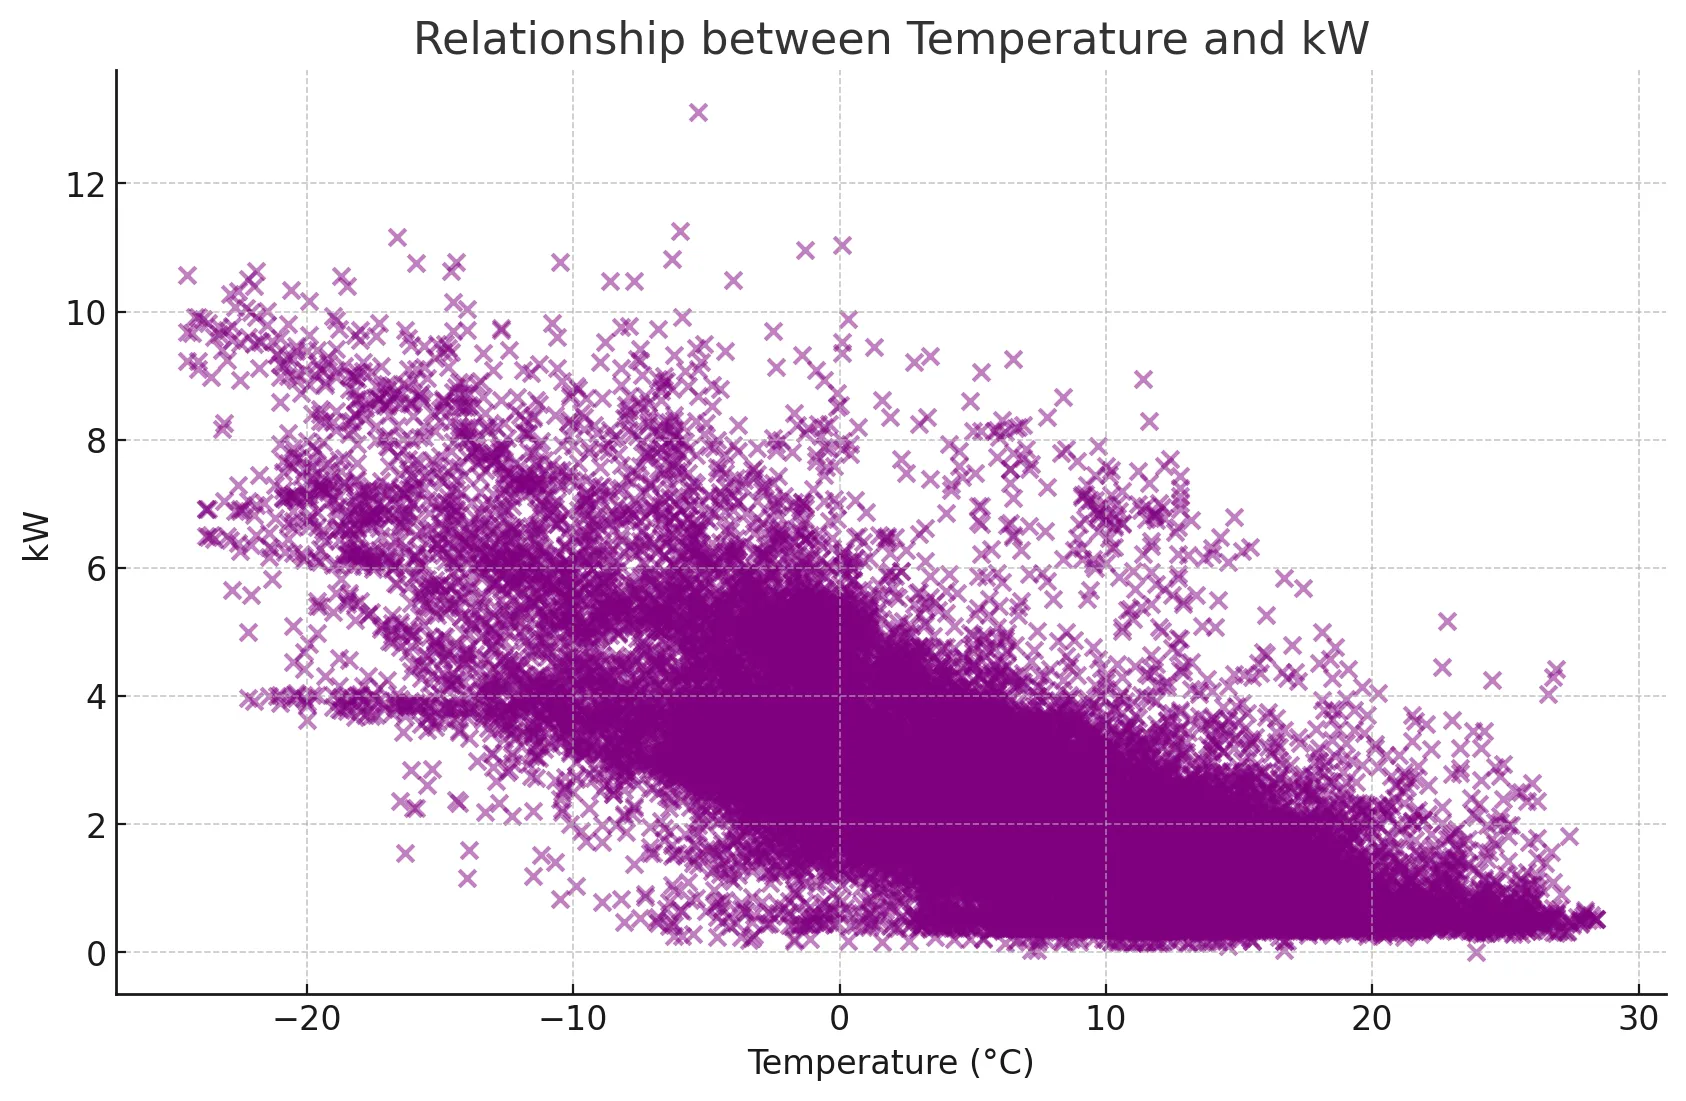
Ok then, lets look at the relationship between electricity consumption and temperature. Lets just naively ask it to plot all the data.
ChatGPT instructions
Draw a chart showing the relationship between temperature and kW
ChatGPT instructions
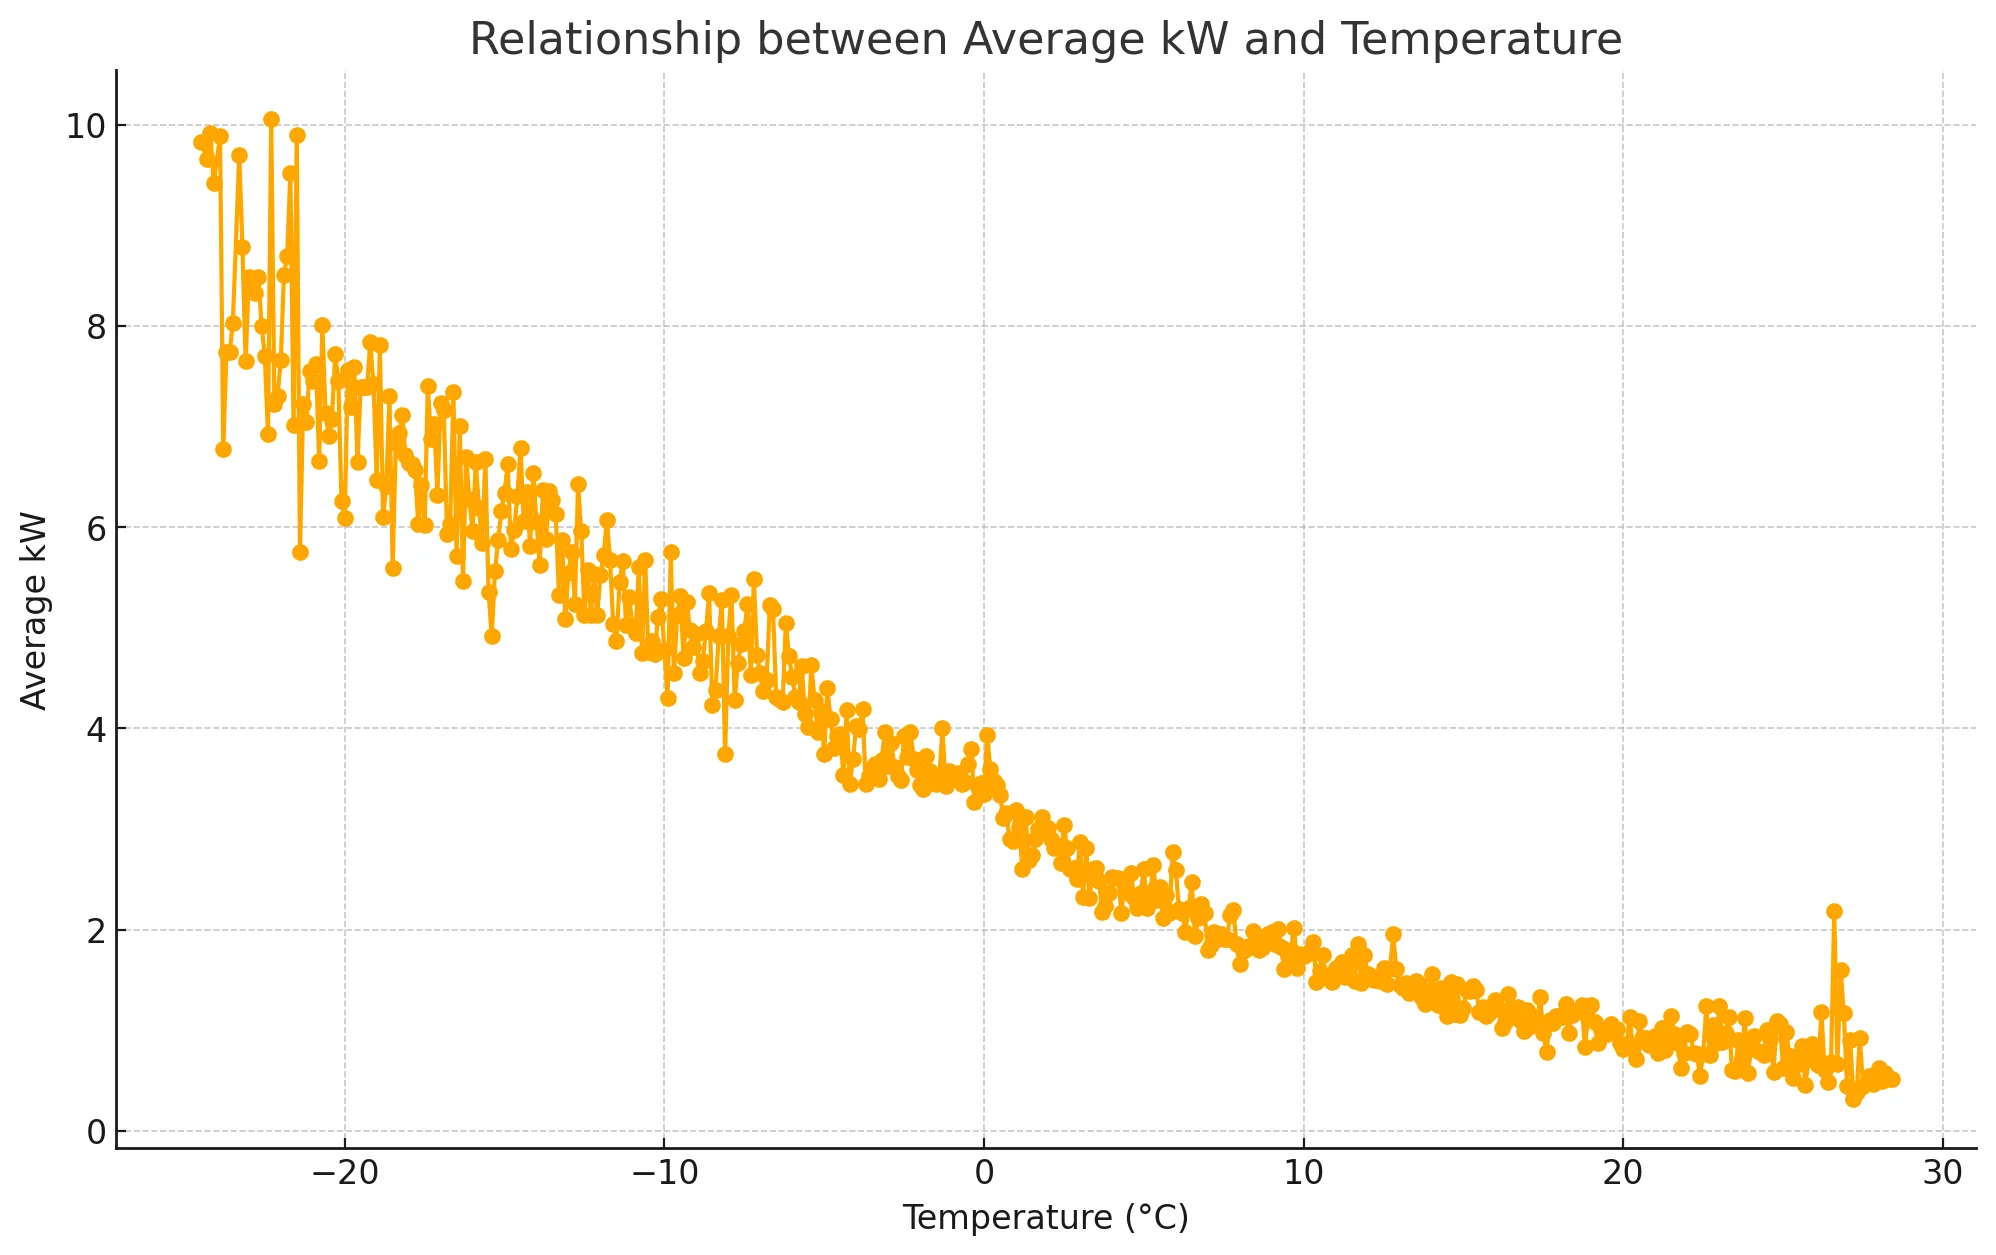
Oops that looks like a mess. Group the data by temperature and average the kW
ChatGPT instructions
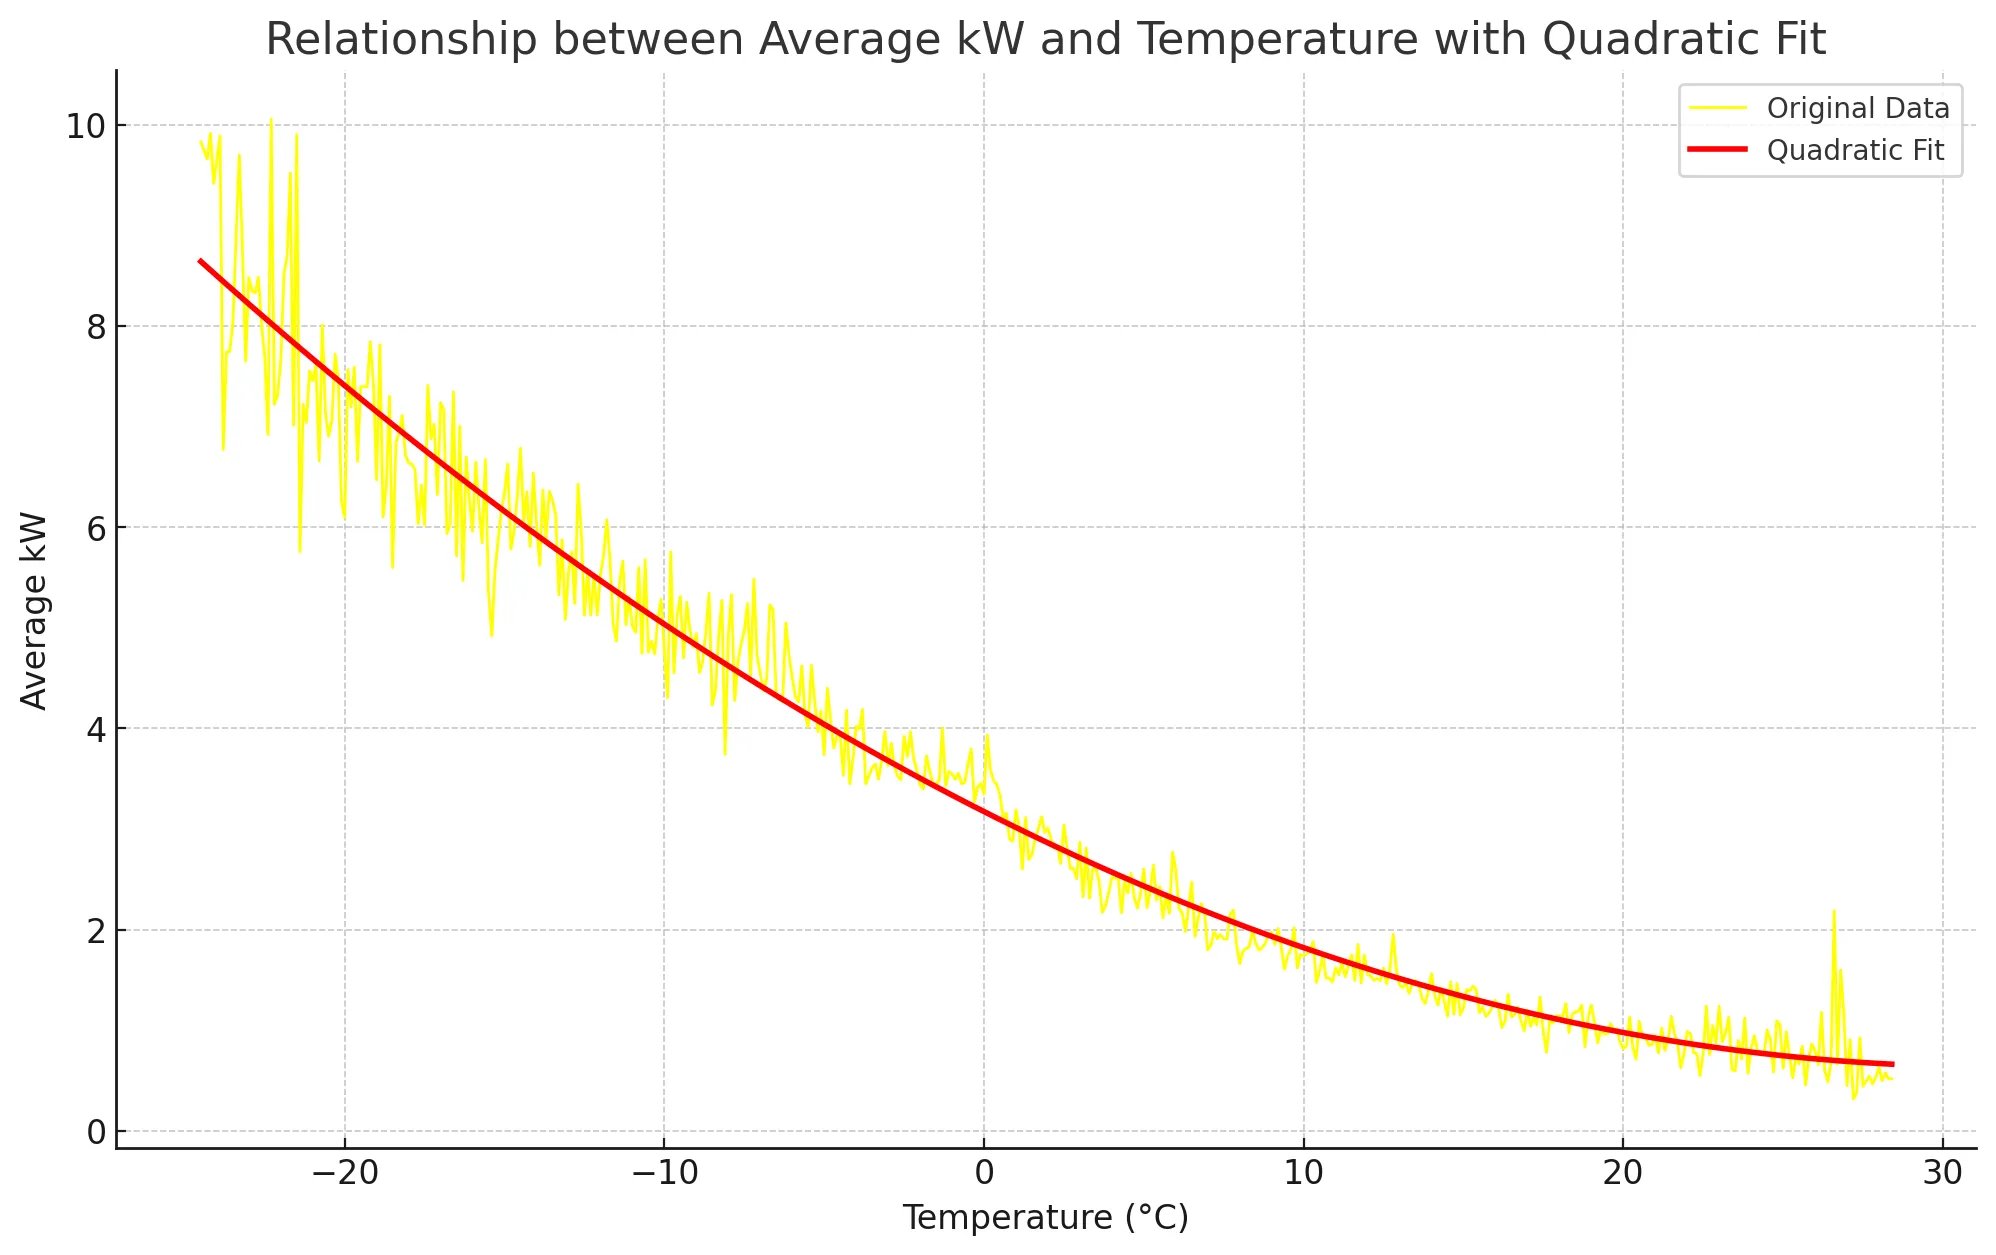
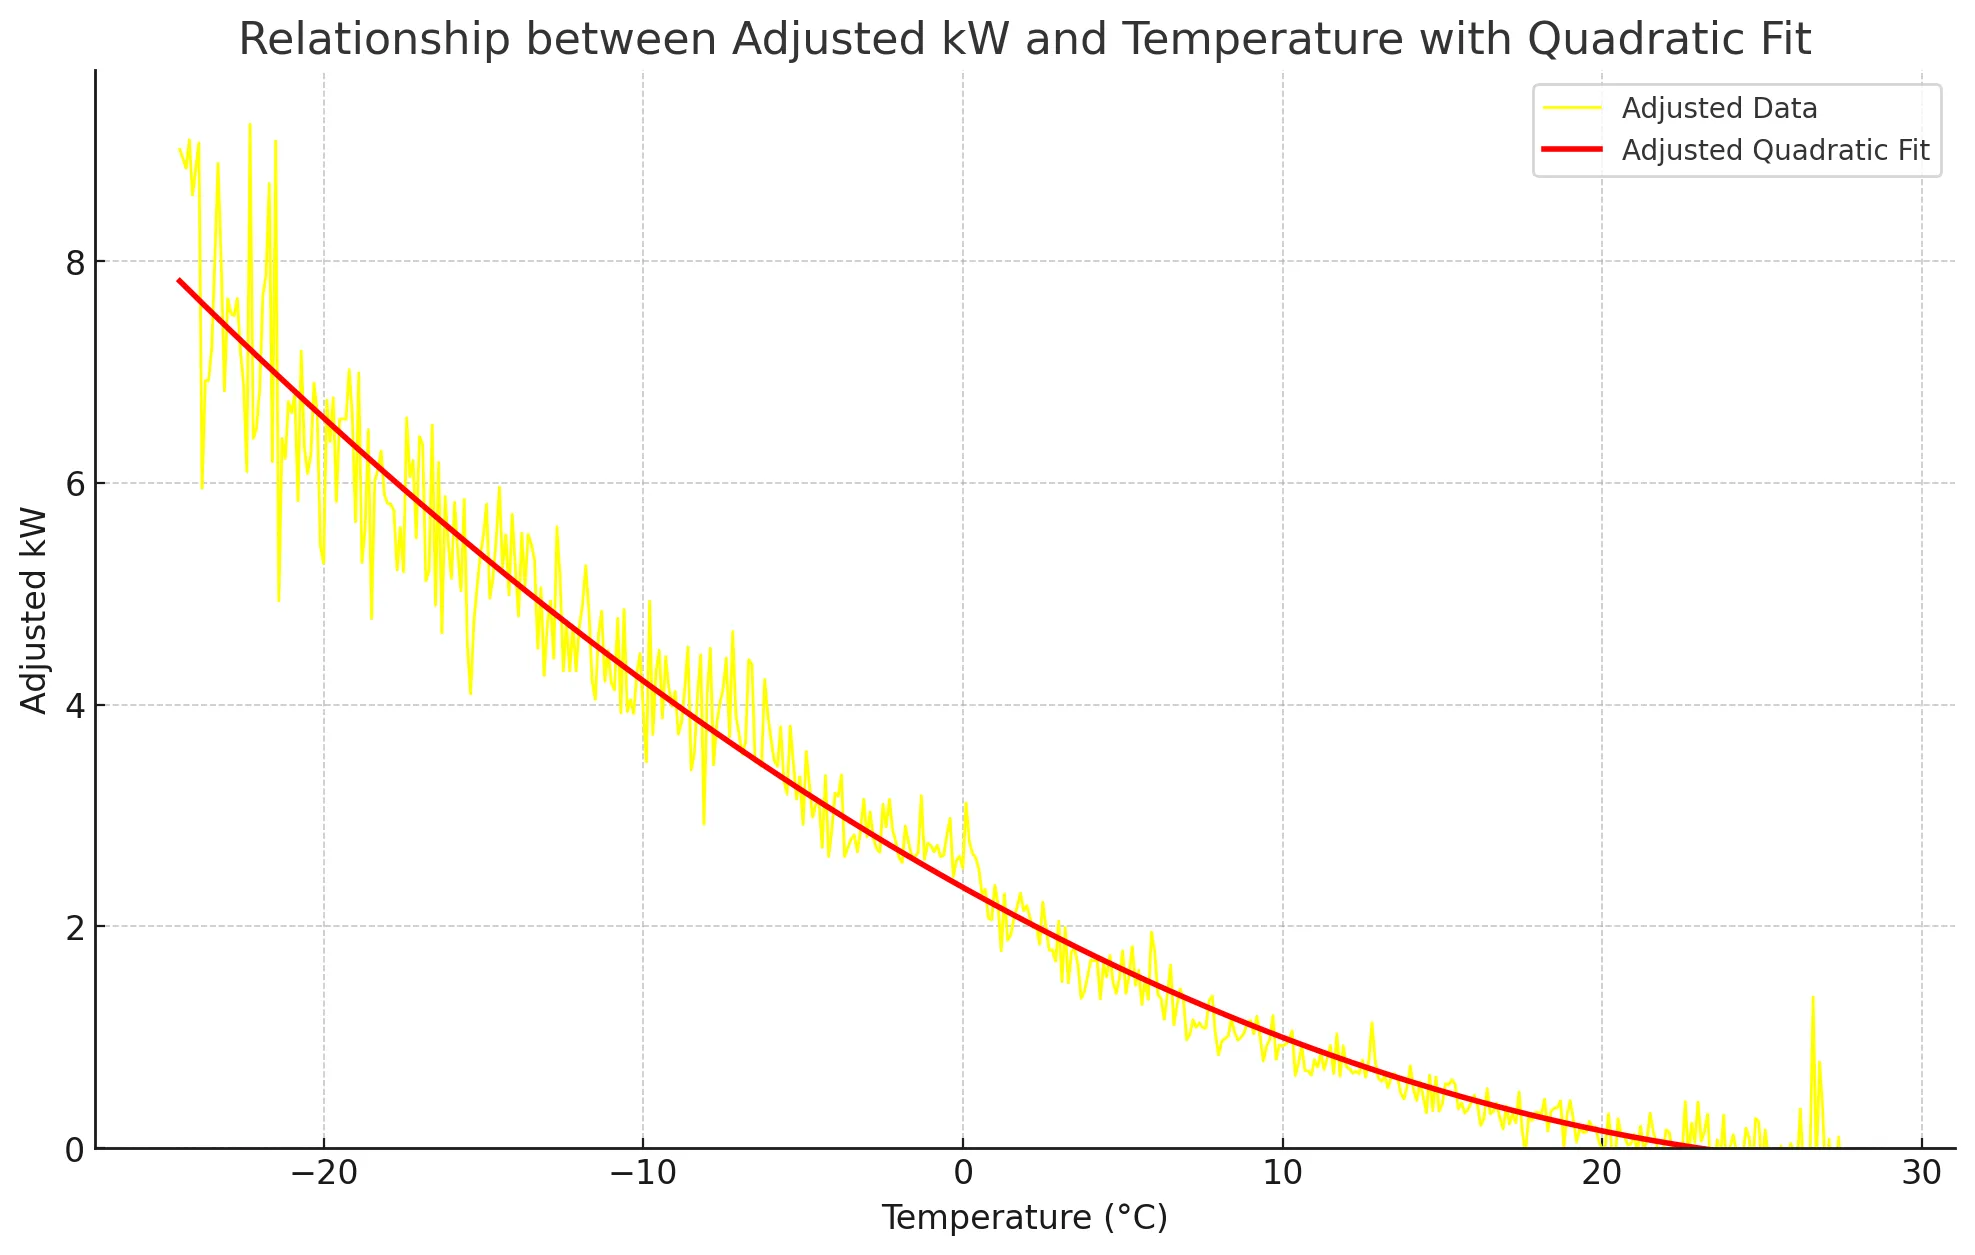
Plot it as a quadratic polynomial fit in red 2px and make the yellow line a simple line diagram 1px without the dots on the data points.
ChatGPT instructions
Excellent. Now it’s evident that there’s an offset from 0 kW, representing the base load,
which includes appliances like fridges, lighting and computers. Calculate the average kW for the temperature range of 24-26 degrees; we’ll refer to this value as baseload.
ChatGPT instructions
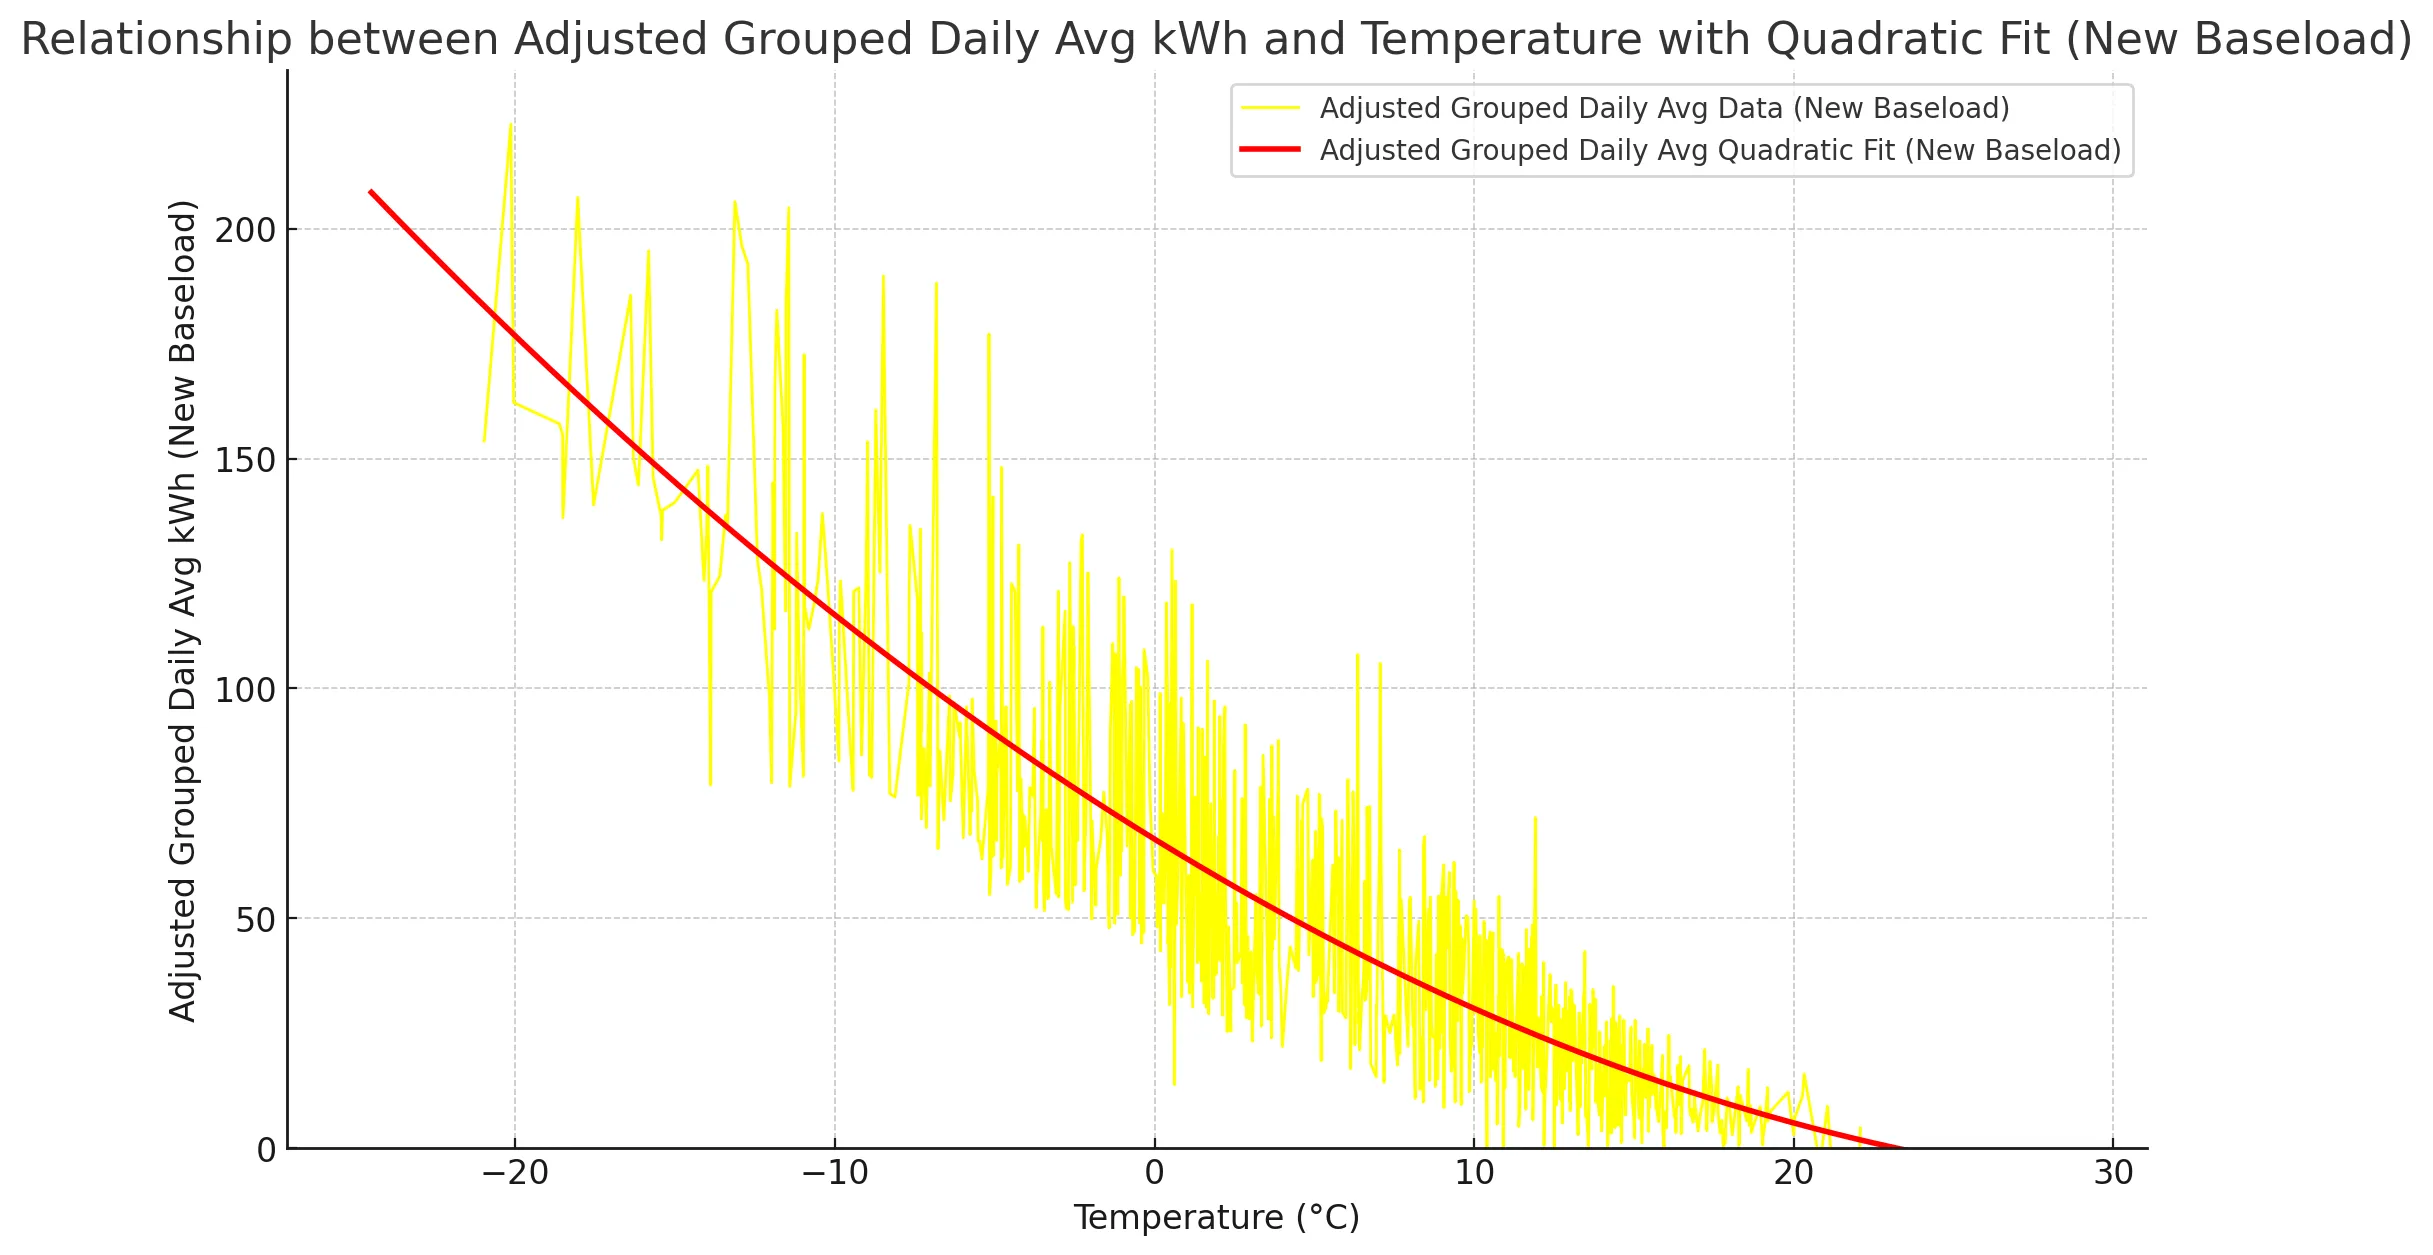
Ok so to the average baseload is 820 watts. Lets subtract that from the data and plot it again.
Make the Y-axis start at 0 even if we clip a little of the adjusted data.
Then make another graph for daily data
Group all hourly data per day so that you take the Average of Temperature and the Sum of kW (kWh).
Then group on temperature and plot the relationship with the quadratic fit etc..
Is air source just useless for me?
Do I even have a heat pump when it uses so much electricity?
I get far bigger numbers than the heat pump is supposed to be able to consume.
It must use alot of direct heating. According to the Specifications it only uses a
maximum of 3kW when producing +45C at +7C outside temperature. I need 55+ when it’s
cold.
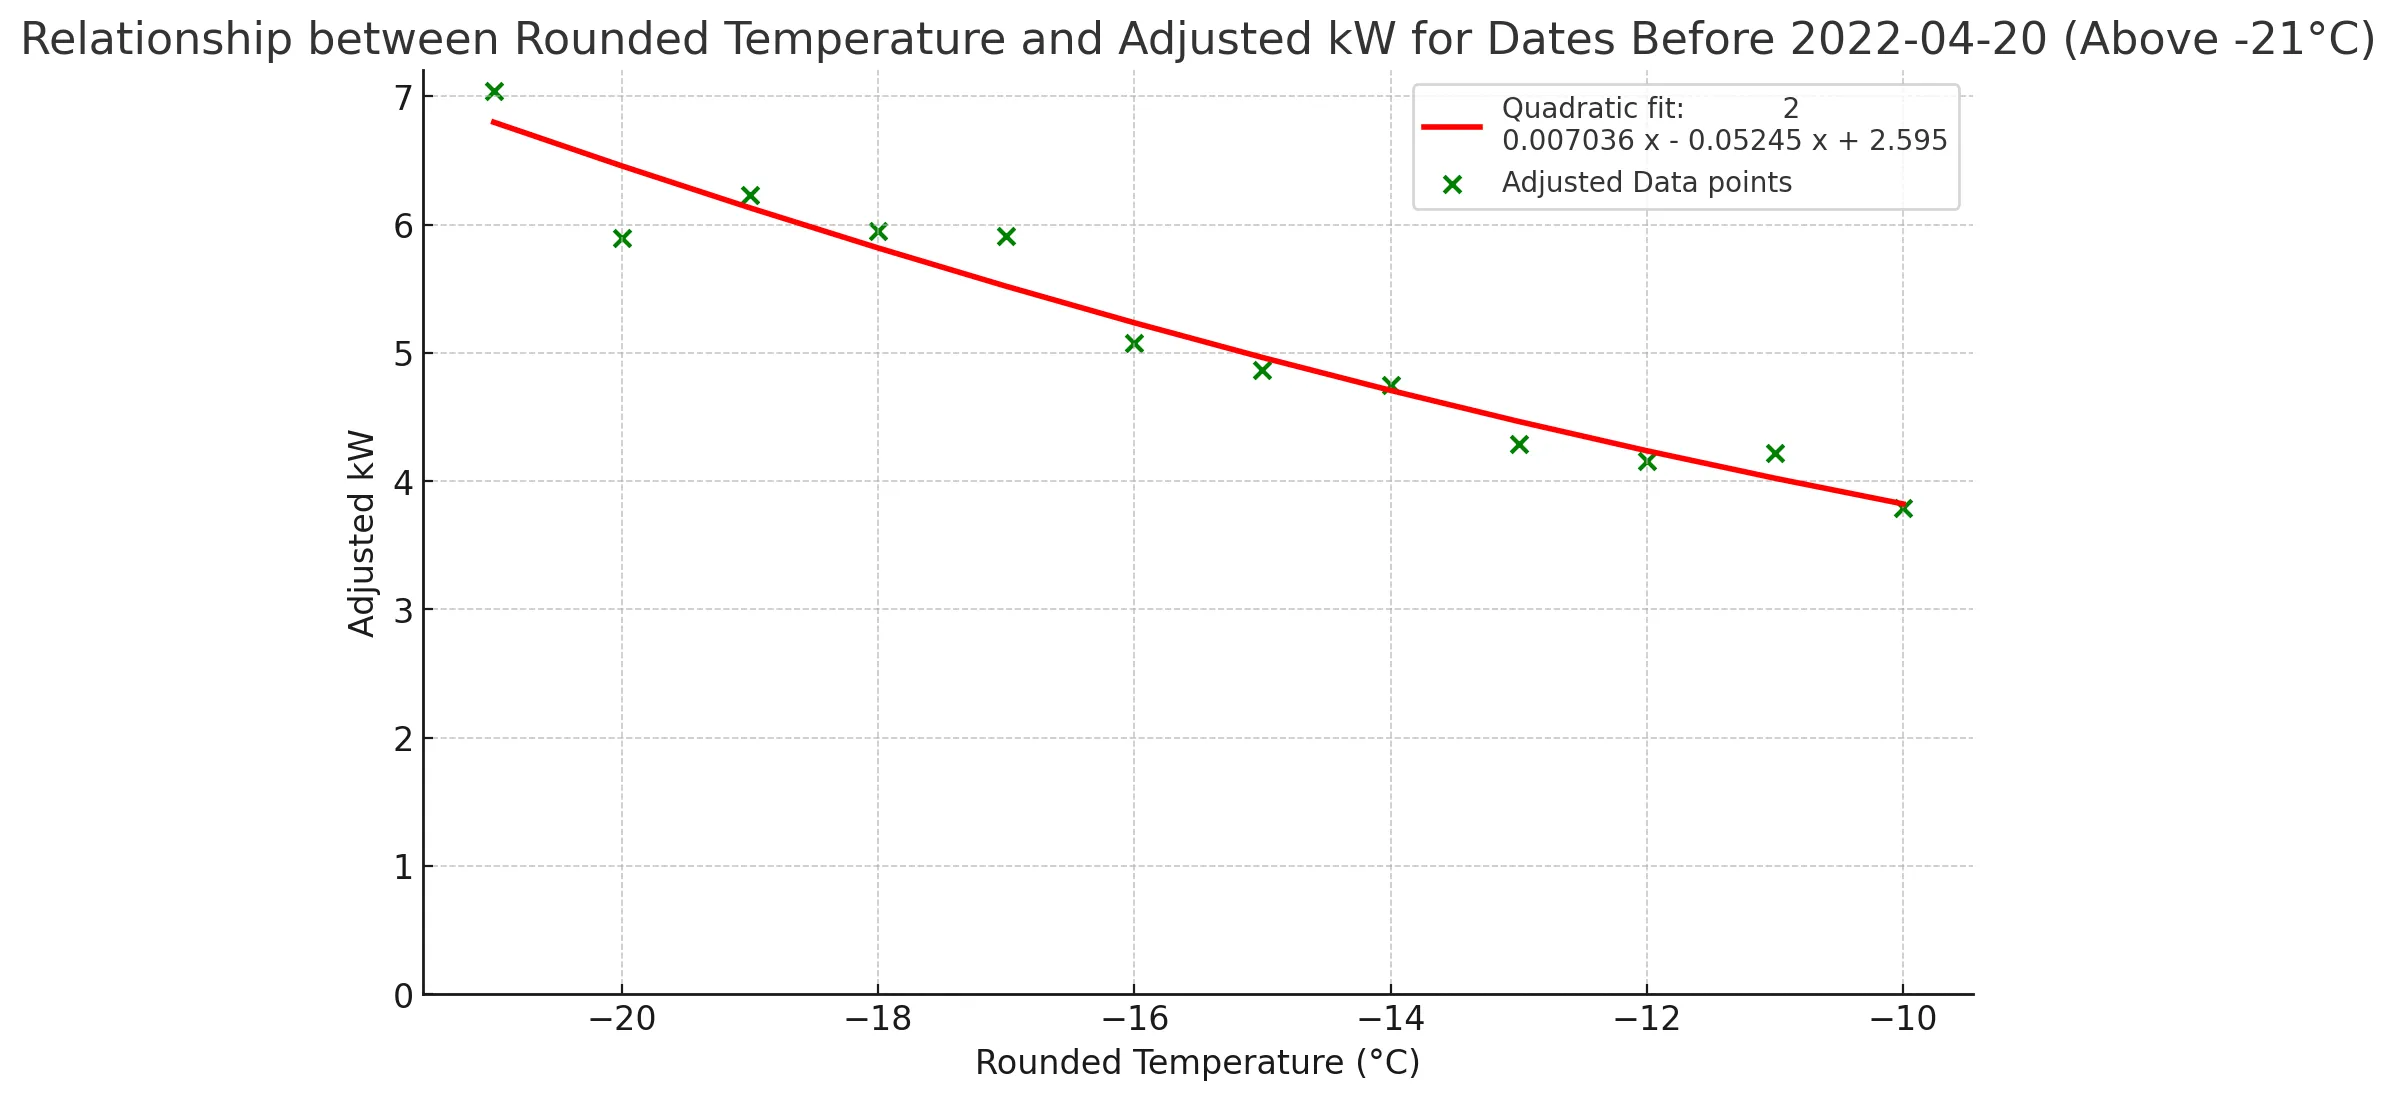
I removed recent data from the calculation. It has after all started to malfunction at
least during most of 2023. After plotting only the first year, grouping the data better
and removing outliers with low sample size I get this
I have a fair number of days with cold temperatures and an old house with
inefficient radiators (high temps needed). What to do? Go to ground source pump instead?
| Temp | Hours below |
|---|
| -10 | 618 |
| -15 | 591 |
| -20 | 107 |
The extremes
The coldest recorded daily average at 2022-12-14 was -21 C with a adjusted daily heating consumption of 154 kWh
The highest recorded adjusted energy consumption was at 2023-01-22 with 223 kWh at -20 C
Looking at the events I think the reason for the difference is that it went from 0 to -20 very fast 2023, but
the coldest day 2022-12-14 was preceded by a few days of -10 to -15 C.
Addendum
Comparison of the periods April 20 to August 31 2021,2022 and 2022
| Year | Average Temperature (°C) | Average Adjusted kWh (kWh) |
|---|
| 2021 | 11.85 | 12.90 |
| 2022 | 12.43 | 22.66 |
| 2023 | 11.65 | 37.88 |
The reduced consumption in 2021 likely stems from the building being a hostel
with a lower base load and cooler temperatures. I prefer warmth; for me,
anything below 24°C is cold.
The consumption spike in 2023 is straightforward: the pump has largely malfunctioned,
and we’re relying on the electric boiler for heating.