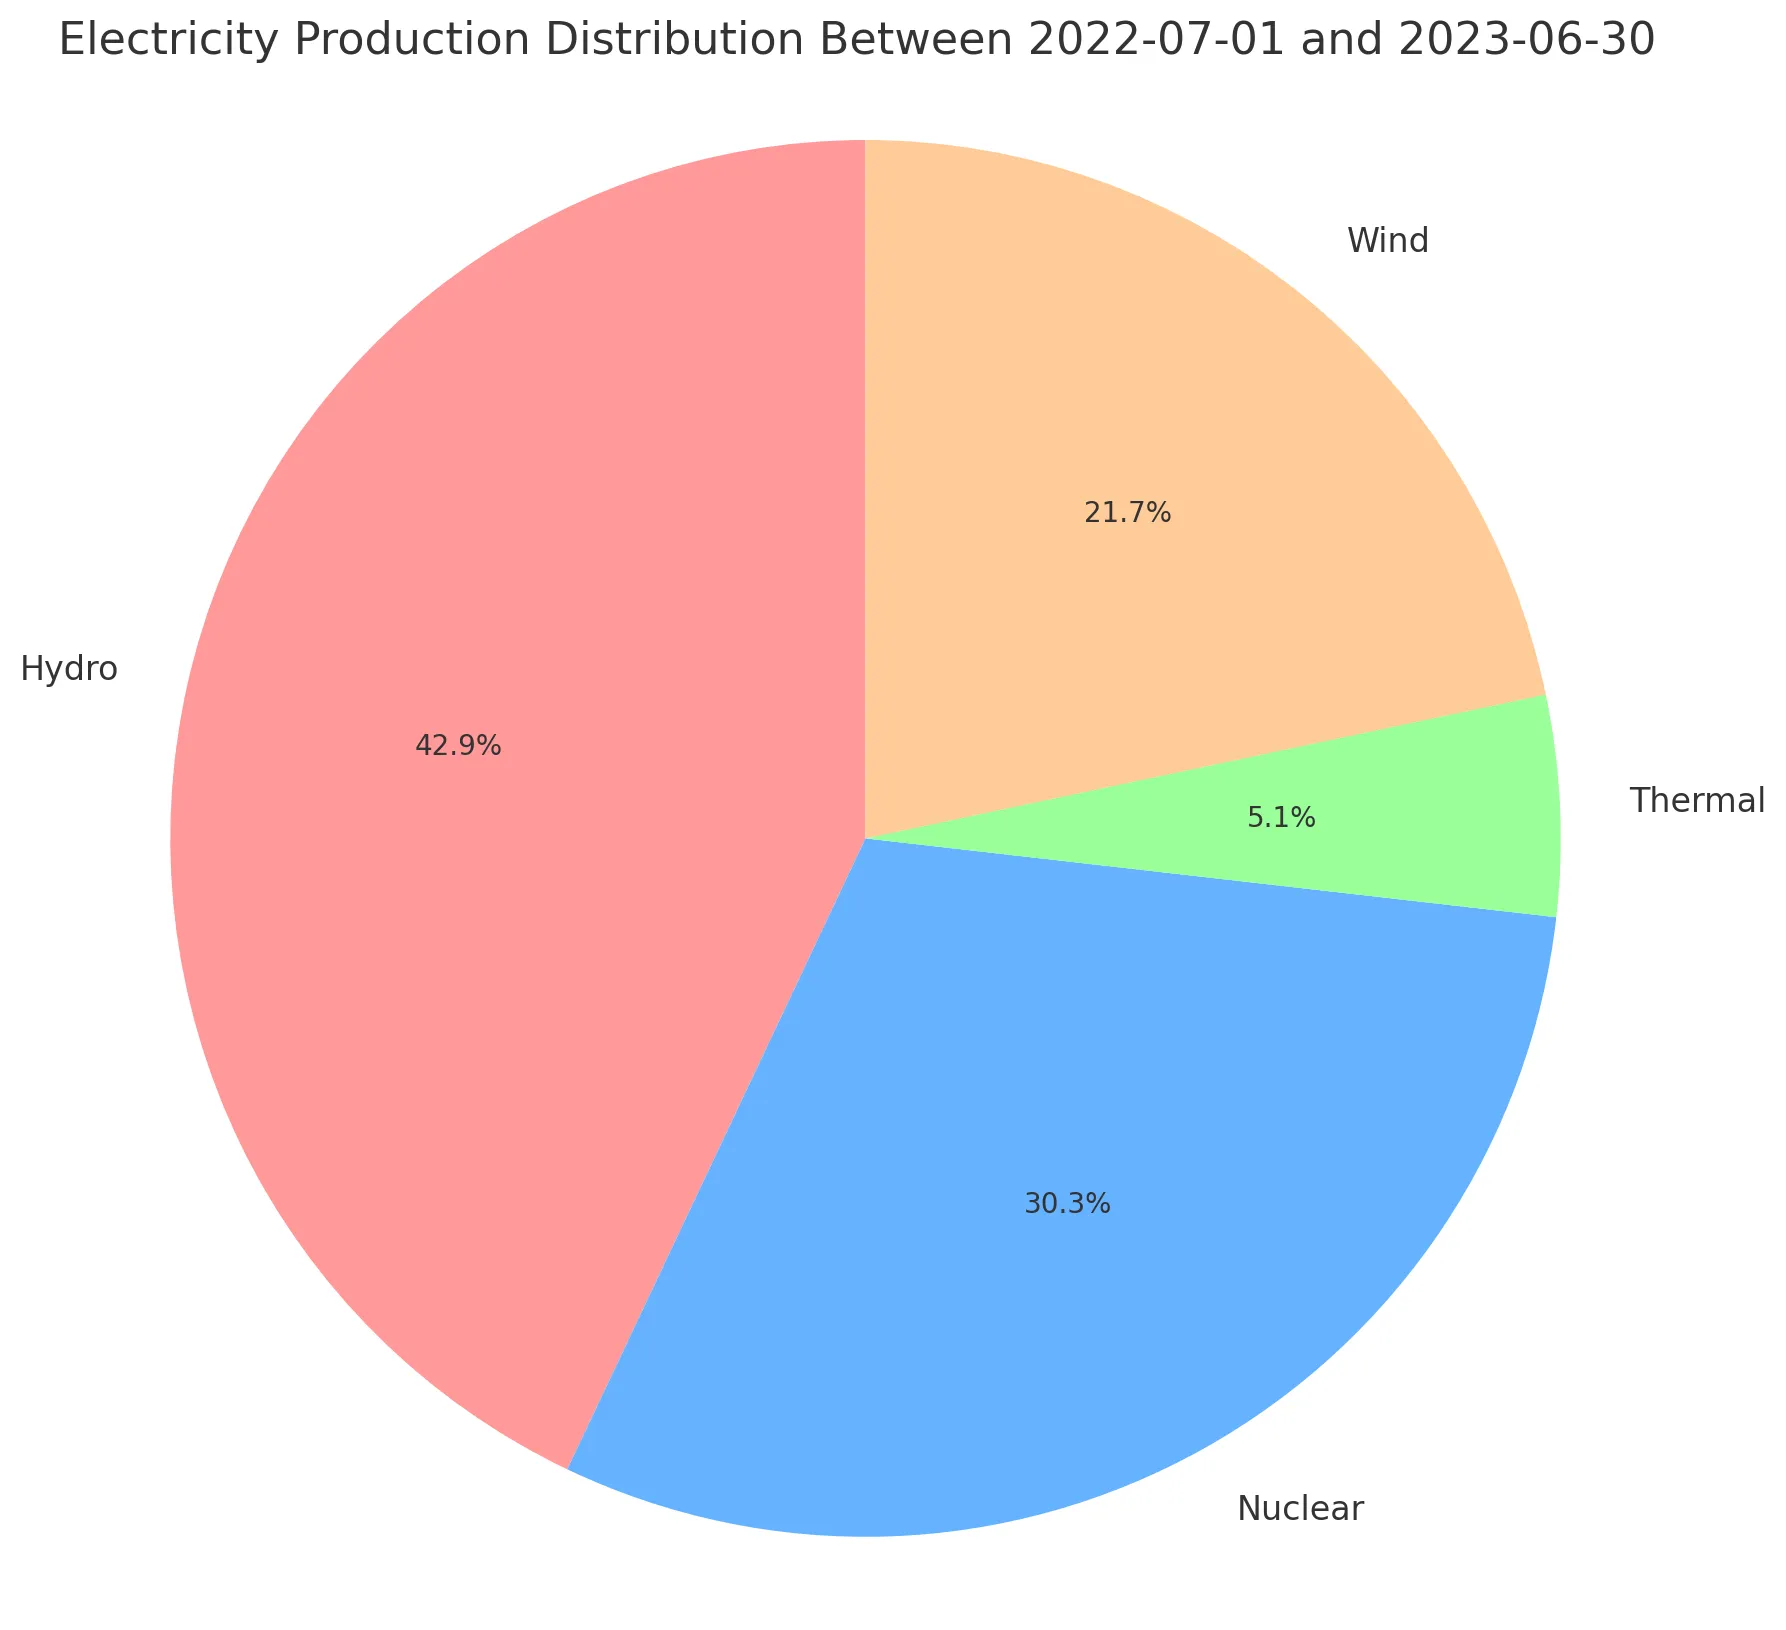
- Give a pie chart with for 2022-07-01 and 2023-06-30
- Ignore the columns Unspecified, Total Production, Net Export and Total Consumption
- Use happy colors
- Oops, ignore SE2 also, that is just prices
Wind power and price in SE2 (Sweden)
Lets play
The code in the next section have given us a file with hourly data about Swedens electricity production, prices and the temperature in Noppikoski.
First I want an overview. I got it in three steps with these very scientific prompts.
Looking good for wind power. Lets dig in to that. Show the production per month
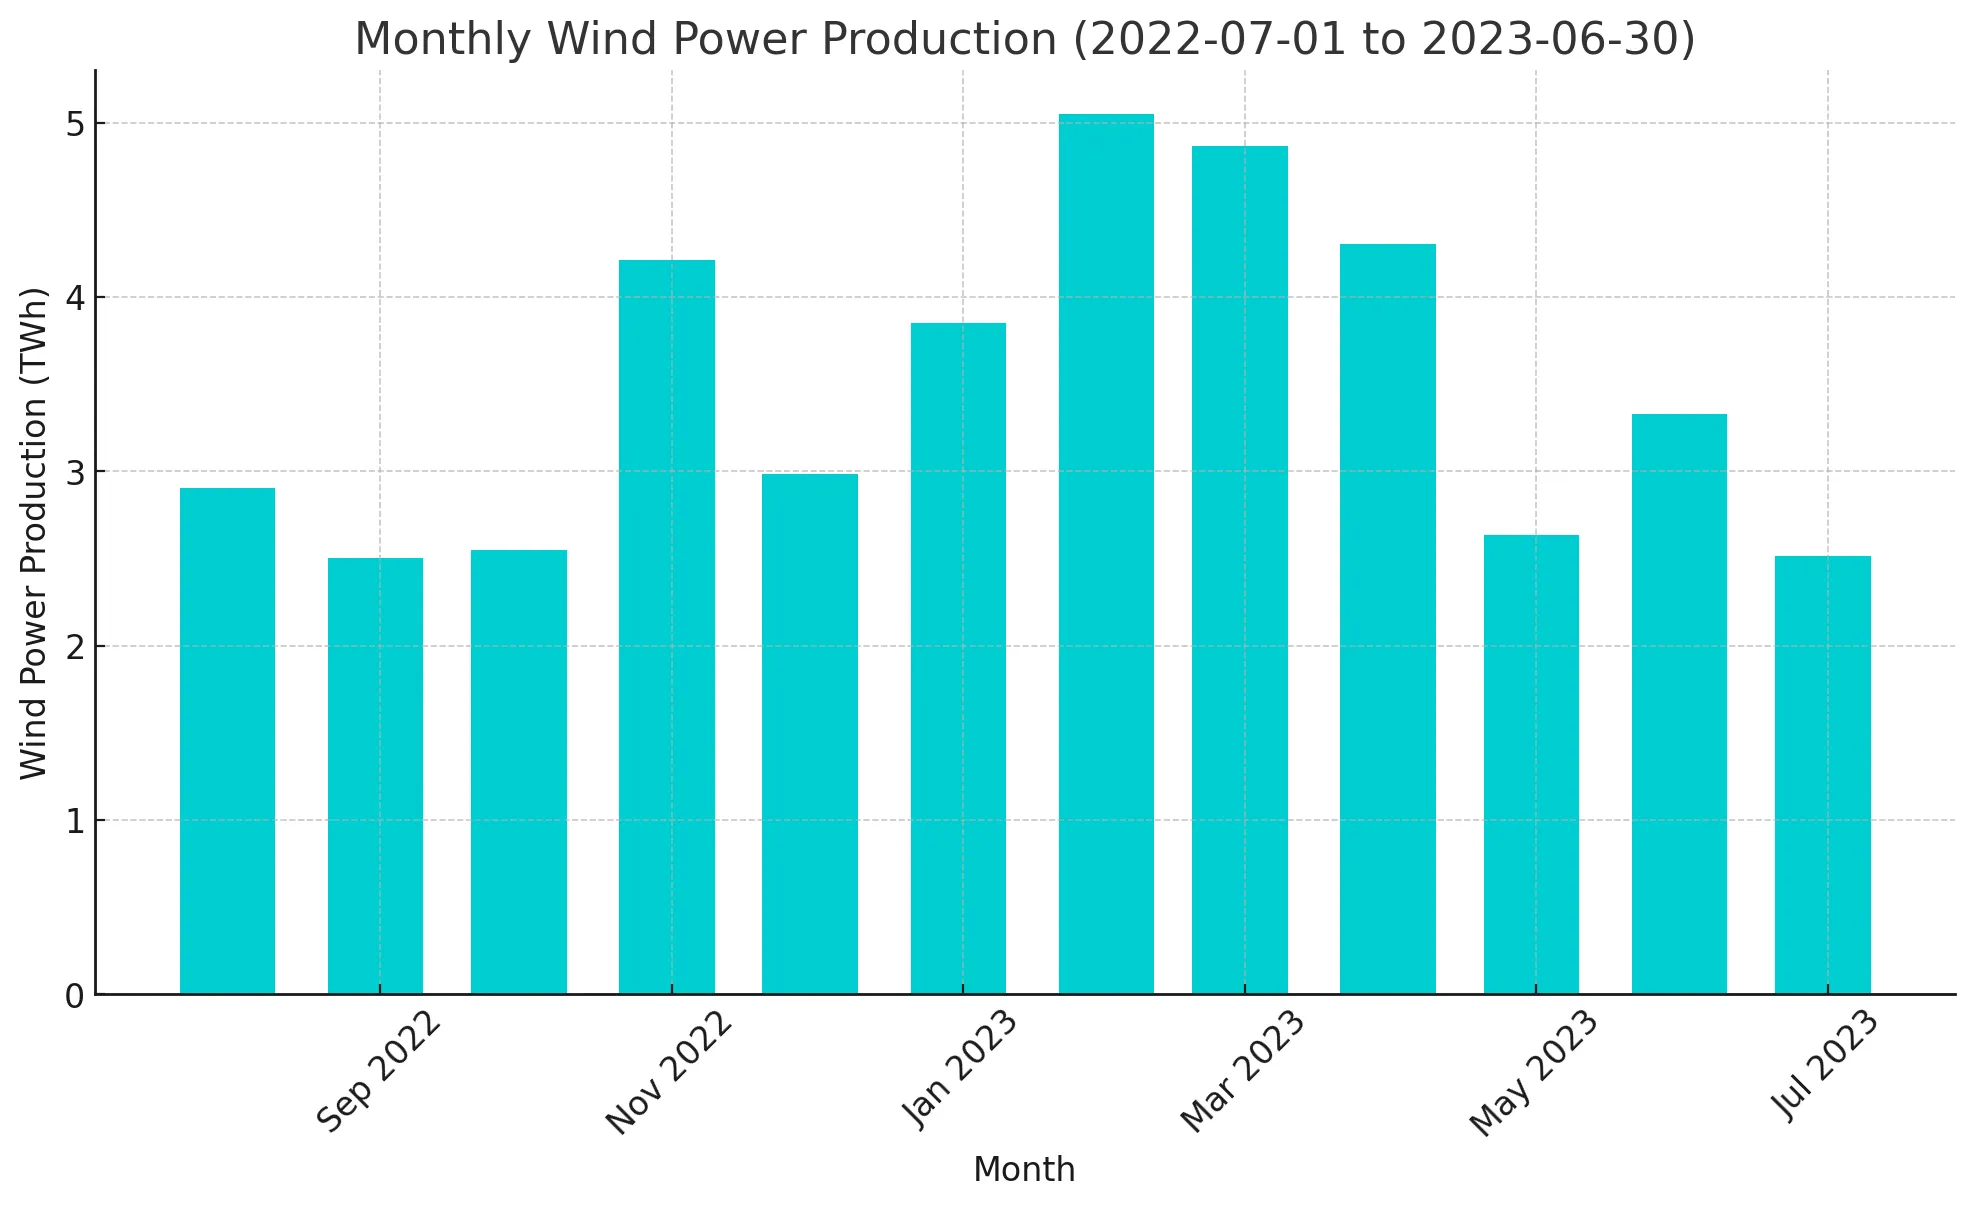
The production is highest in the winter months. That was a bit of a surprise to me. Let’s examine if there is a correlation between wind power nationally and the price of electricity in my region SE2.
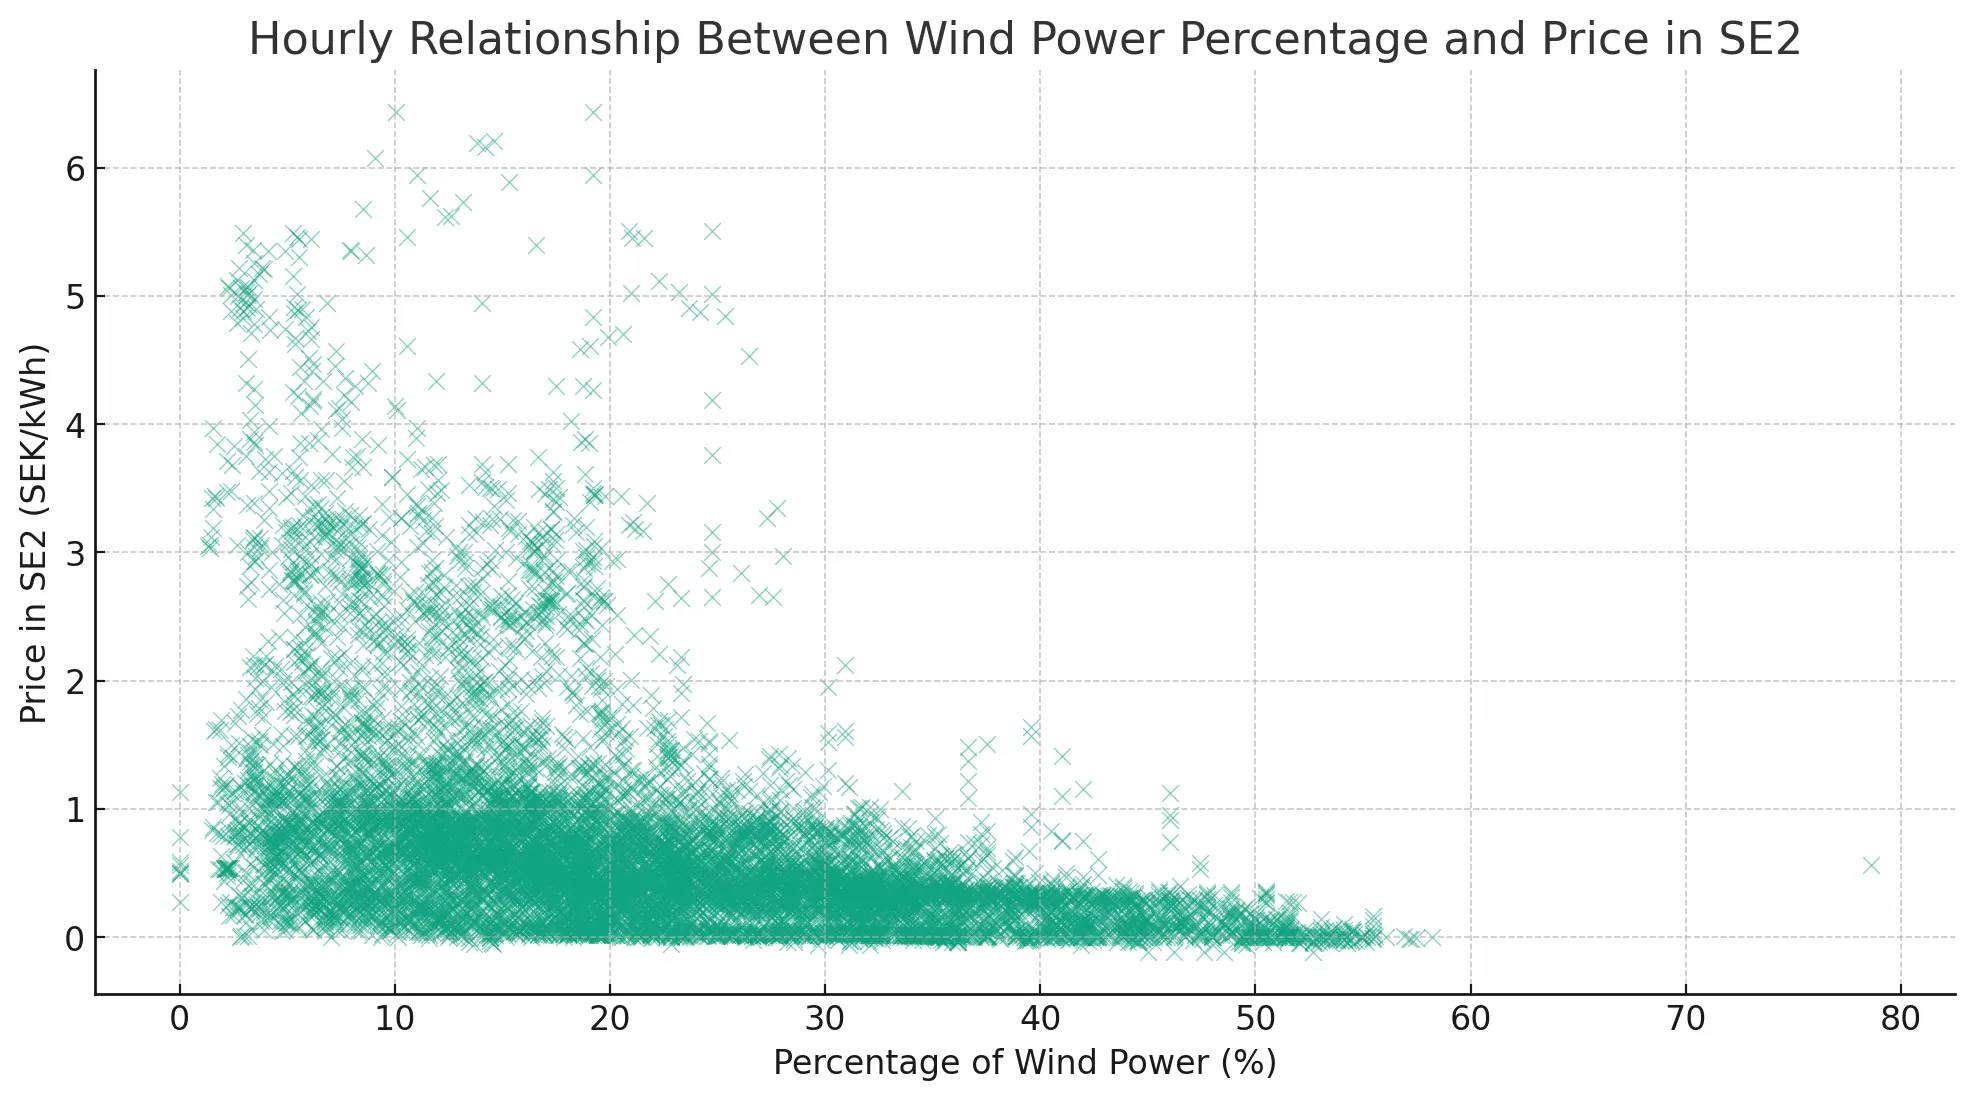
Not surprising, but perhaps not as strong as I expected (-0.44). I asked for what month
has the highest correlation. To no one’s surprise, it was January (-0.76). Let’s look at that.
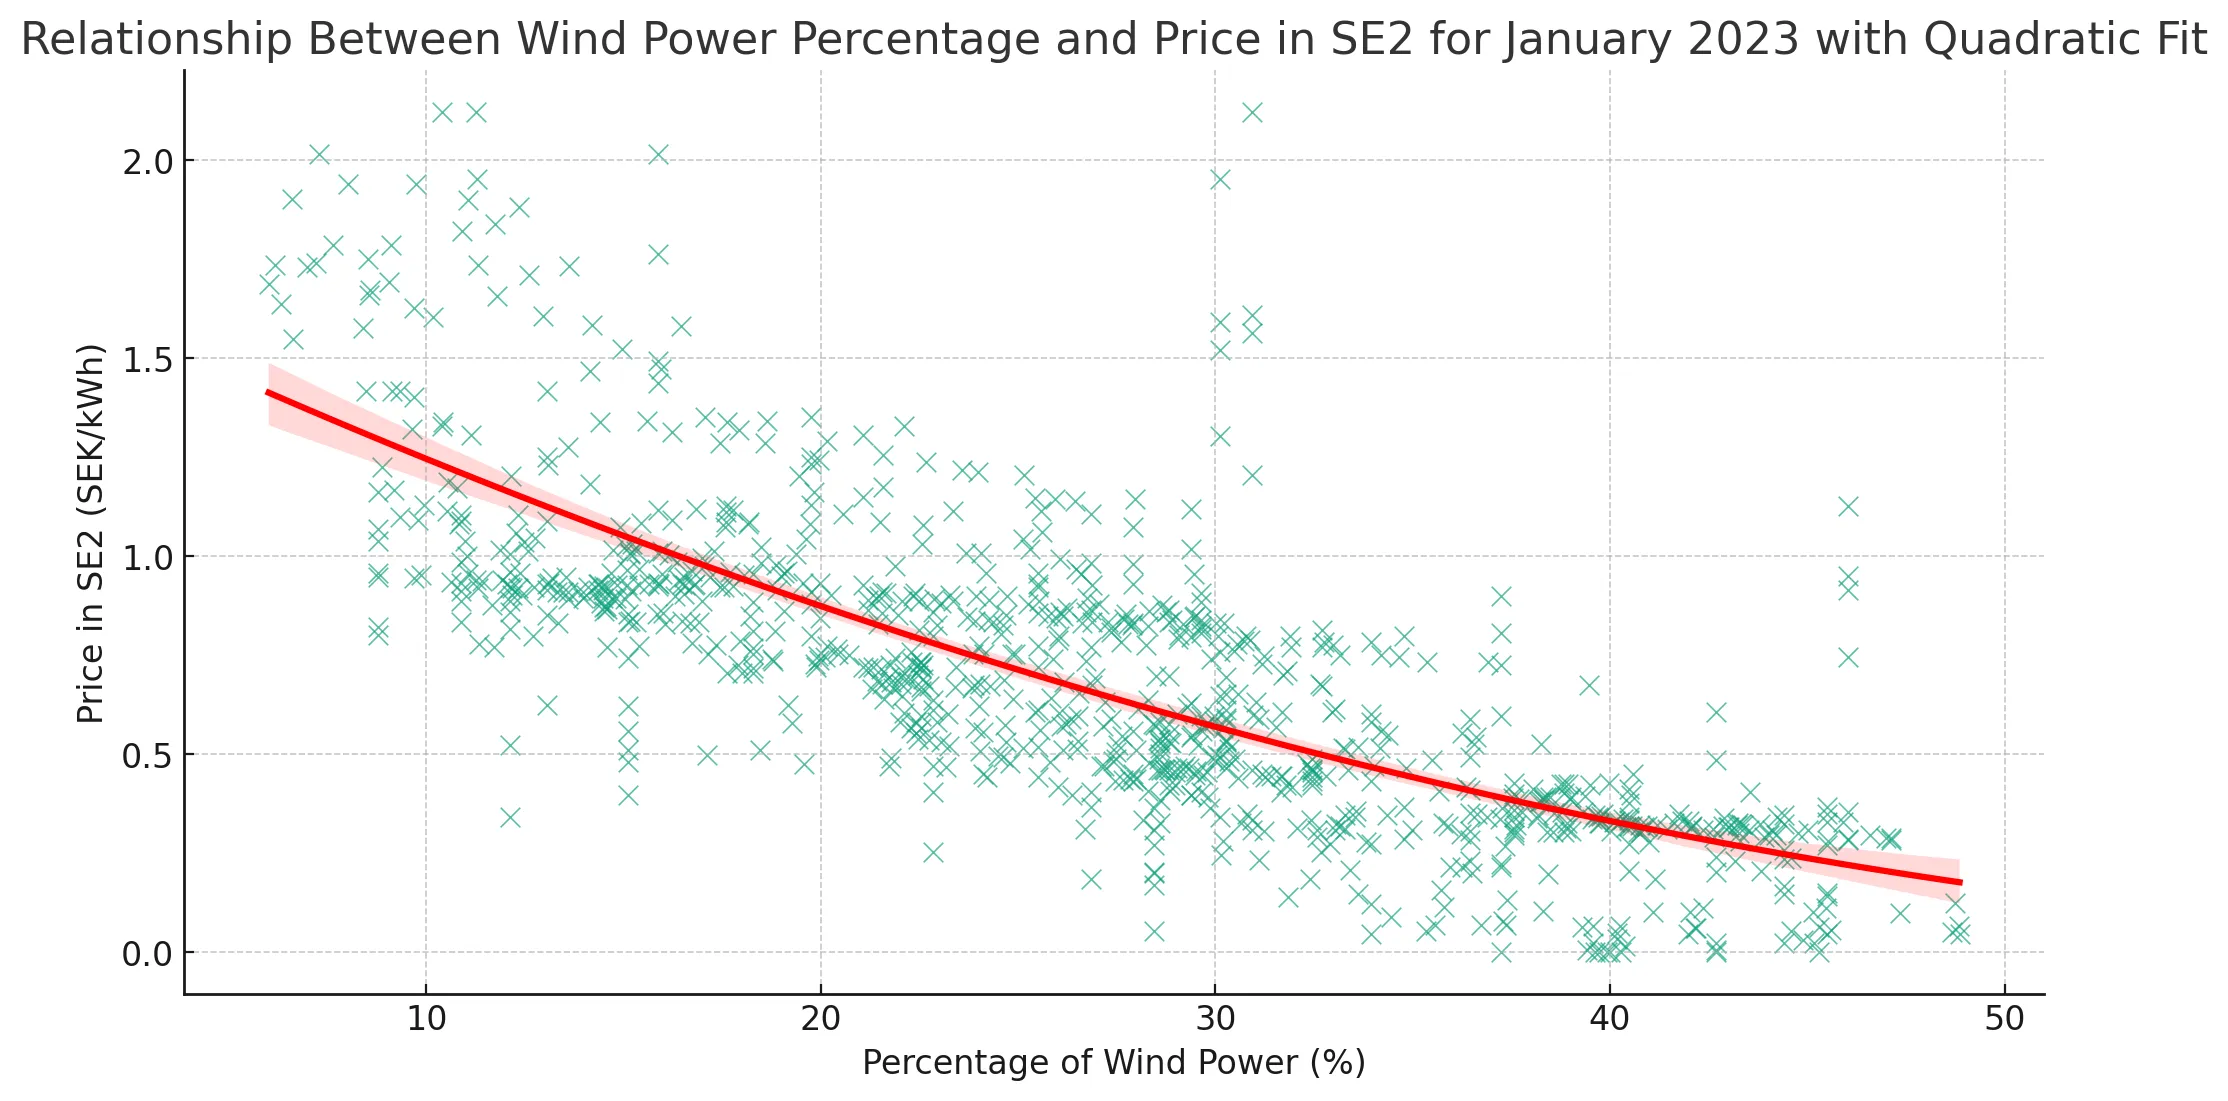 Now we are talking! The unfortunate reality for wind power as it grows to be a larger part
of the grid is that prices fall dramatically when the wind blows.
Now we are talking! The unfortunate reality for wind power as it grows to be a larger part
of the grid is that prices fall dramatically when the wind blows.
In January
- When delivering 10% of the grid production they get 1.25 SEK/kWh.
- When delivering 50% of the grid production they get 0.16 SEK/kWh.
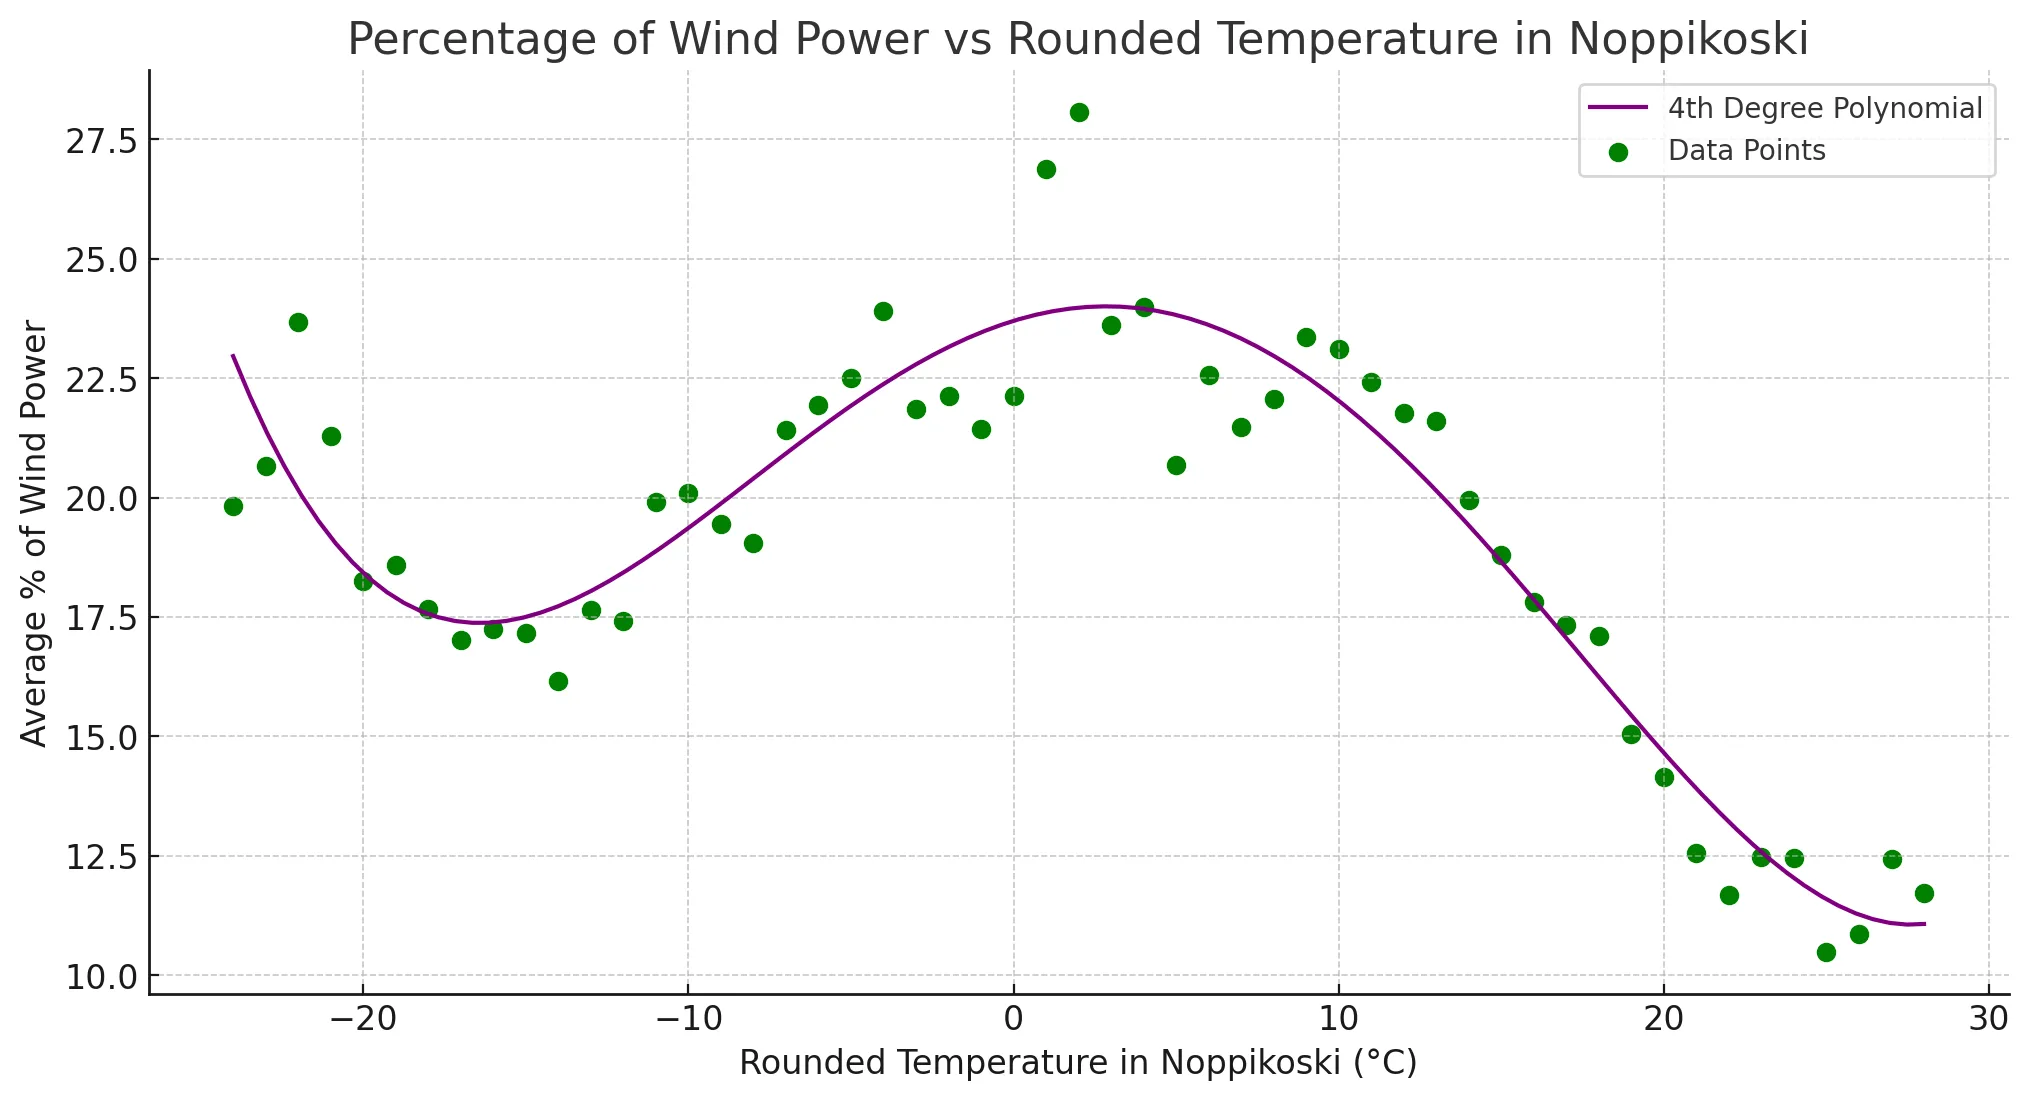
In relation to temperature in Noppikoski.
This one is just plain weird. The temperature in Noppikoski is hardly a good proxy for the temperature in Sweden. The result is also very surprising. What is even going on here? This is based on hourly data between 2021-04-20 and 2023-08-31. My first thought is that there are too few data points under -20°C. It is, after all, only 136 hours (out of 18238) recorded below -20°C, so if that happened while it was a few windy days in other parts of the country, that probably explains it.
Code
First we need data and here Svenska Kraftnät provides an awsome site for viewing real time and historical data on electricity generation and prices in Sweden.
Getting the data.
The format their site use is trivial. There are 8 columns (id) that we have to identify the sources for and the data is simply an array of unix-timestamps and values in MW.
{
    "Data": [
      {
        "id": "2",
        "data": [
          {
            "x": 1693864800000,
            "y": 4257
          },
        ]
      }
    ]
}
Instructions to ChatGPT
Given the request format: https://www.svk.se/services/controlroom/v2/production?date={date}&countryCode=SE
Give me a script that:
Downloads all days (inclusive) from 2021-04-20 until 2023-08-31
Sleep random (0.5-1.5) seconds between each request
Save the data in the subfolder “svk-data”
The data set is pretty 300 MB so I will ask for scripts that I can apply locally.
There are 8 energy source columns in: /Data/*/
Every source as an id and a time series indata/*/
x is an UTC unix timestamp with ms precision,
y is the production as a number (MW)
The id values translates to the energy sources ‘column_names’:
“1” to “Total Production”
“2” to “Nuclear”
“3” to “Hydro”
“4” to “Thermal”
“5” to “Wind”
“6” to “Unspecified”
“7” to “Total Consumption”
“8” to “Net Export”
Group the data by energy source and hour, averaging the values for each hour. Convert the input to Excel with those ‘column_names’.
Convert UTC to local time. Just add two hours regardless of daylight savings. It’s good enough for us
Convert the sample file to Excel as a test. Create a script for local execution that take all json files in the subfolder “svk-data” and saves the result in “svk-data-processed.xlsx”.
After this I just gave it the hourly prices from nordpool and my temperature data for Noppikoski and asked it to merge everything.
This file is what we play with above.